CINCHSCOPE examples of improvED Resolution over widefield or confocal microscopy
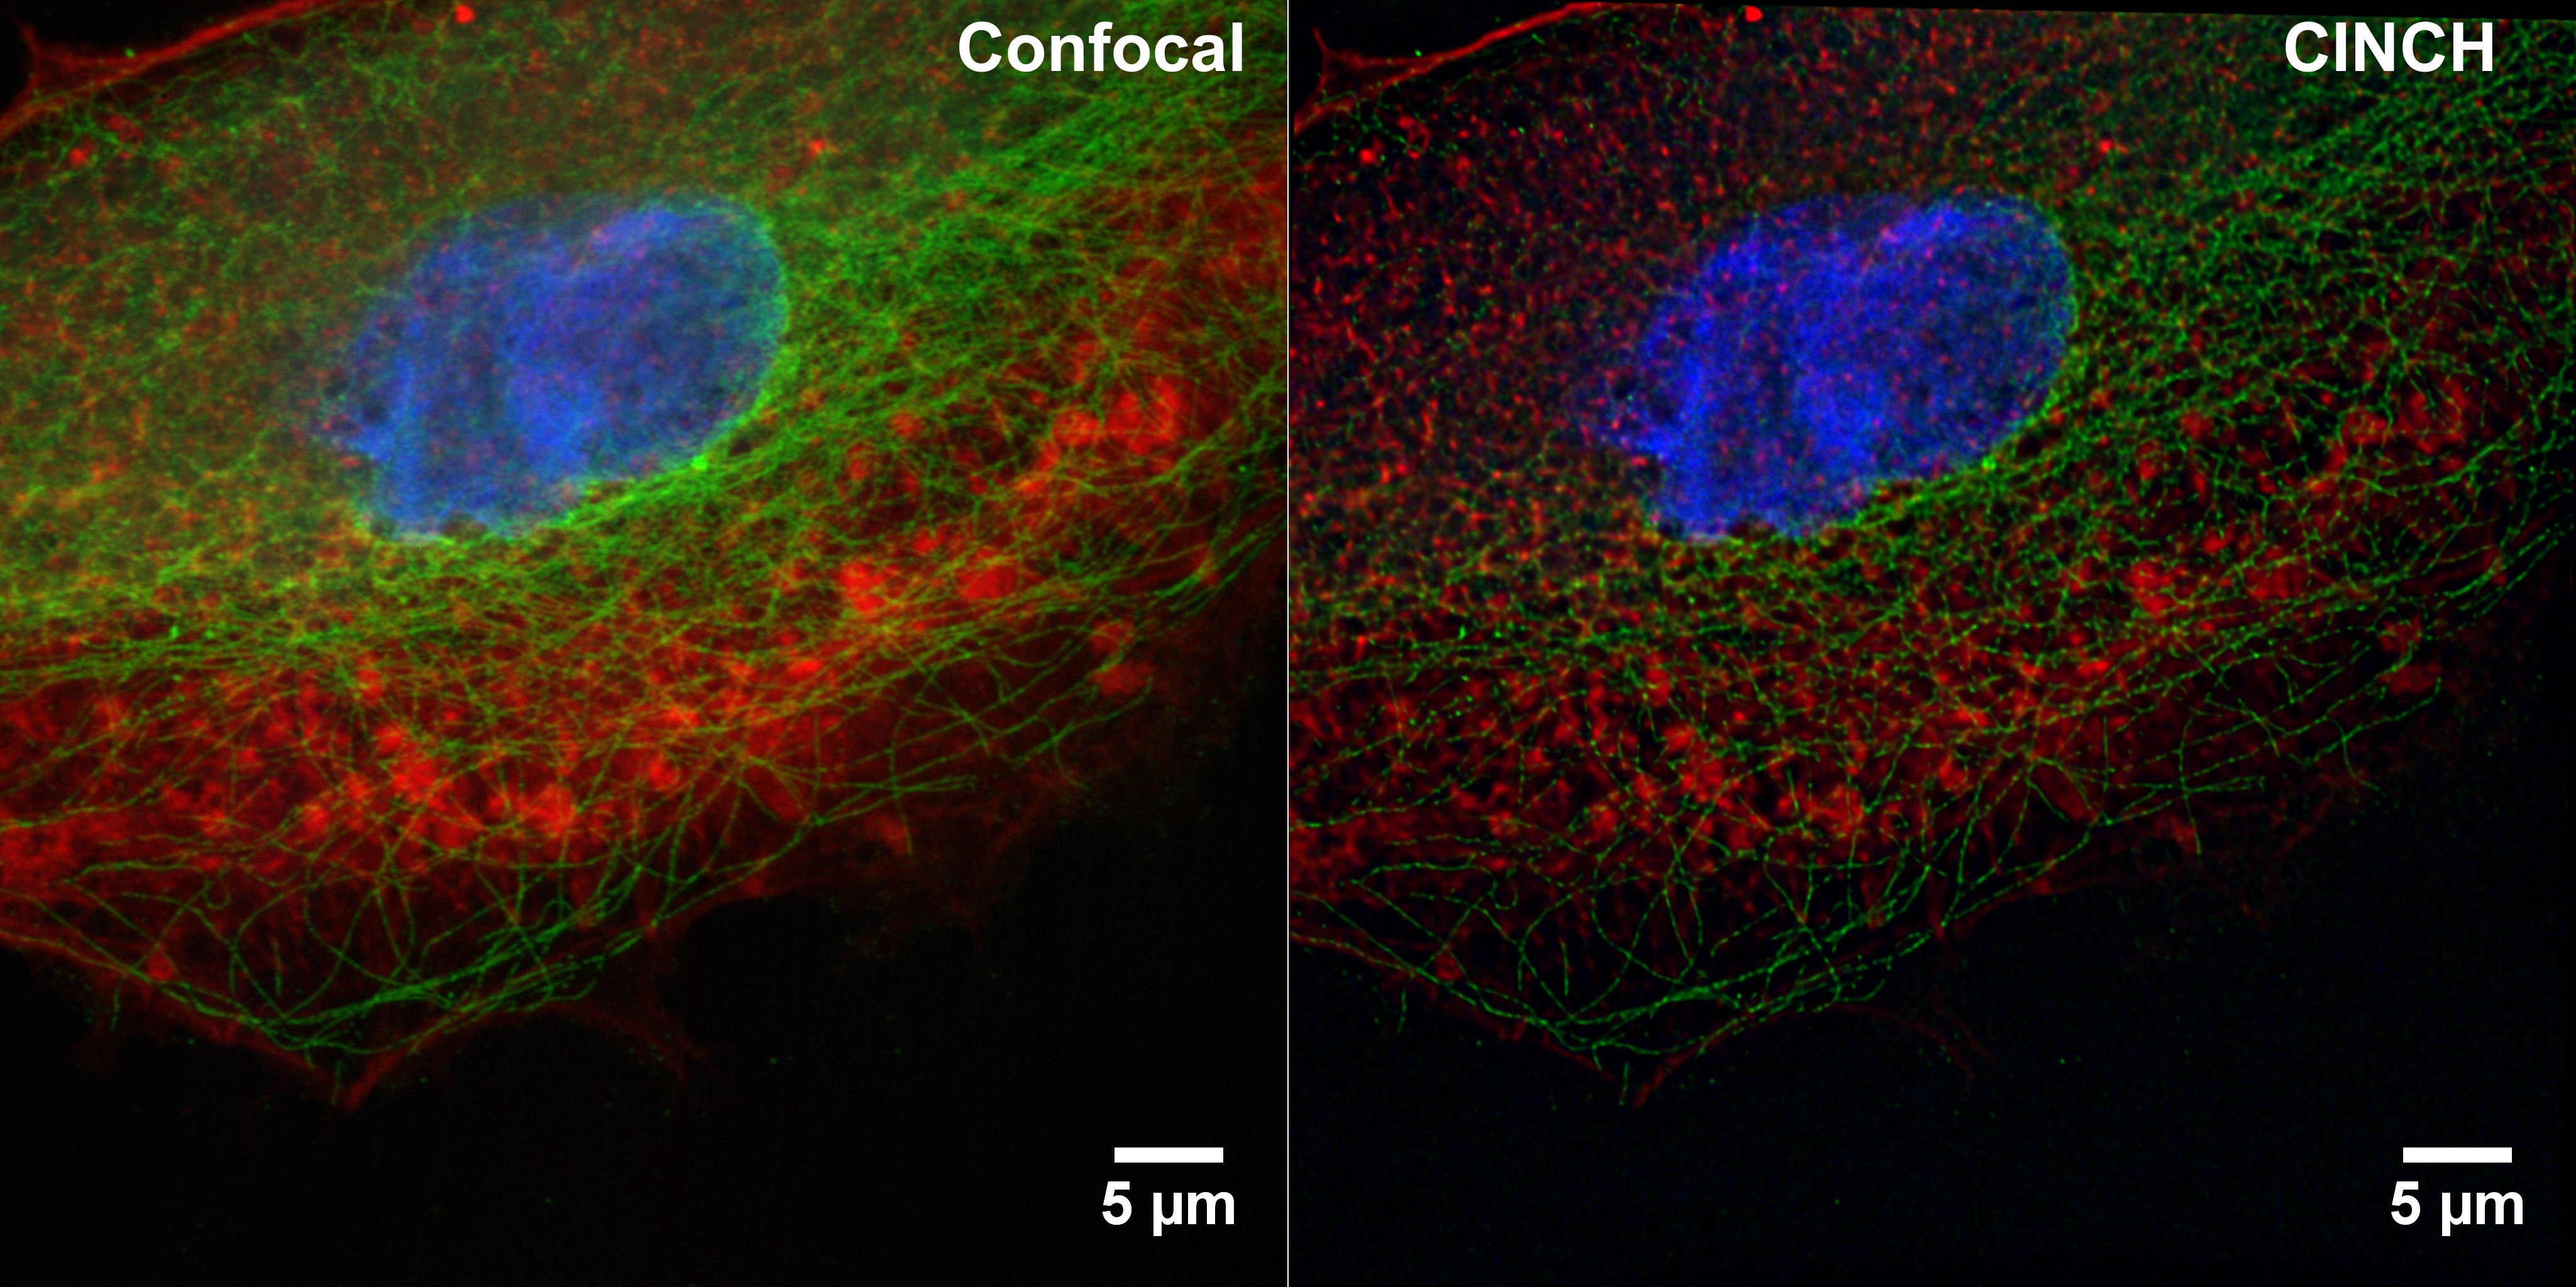
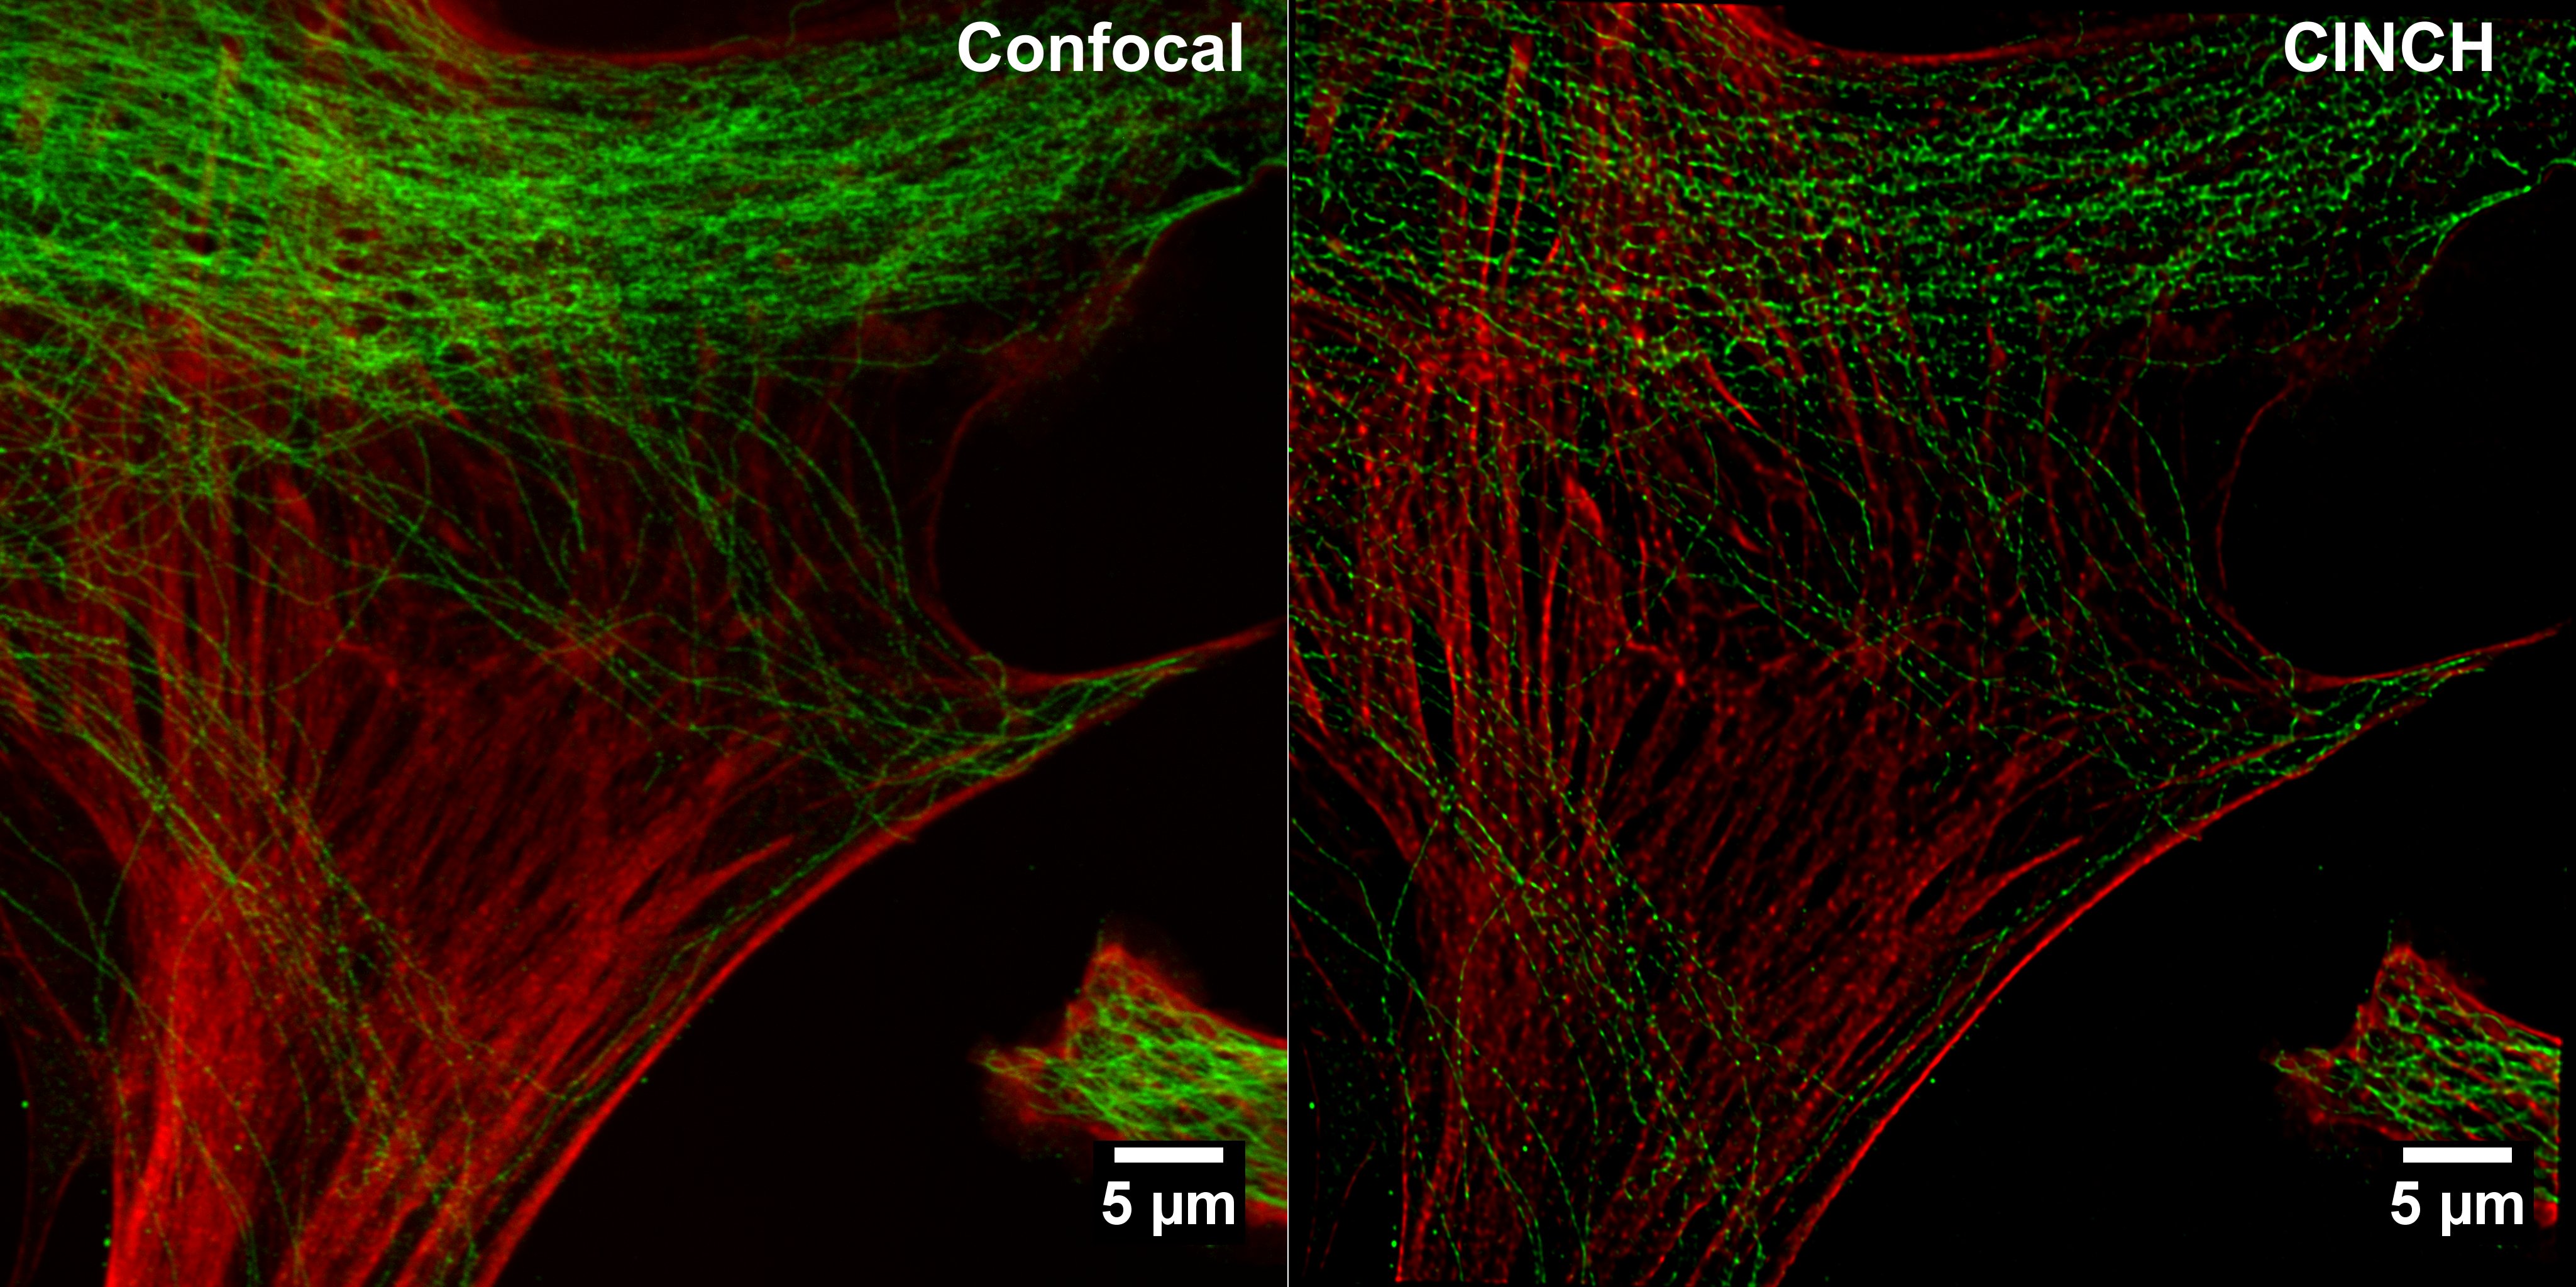
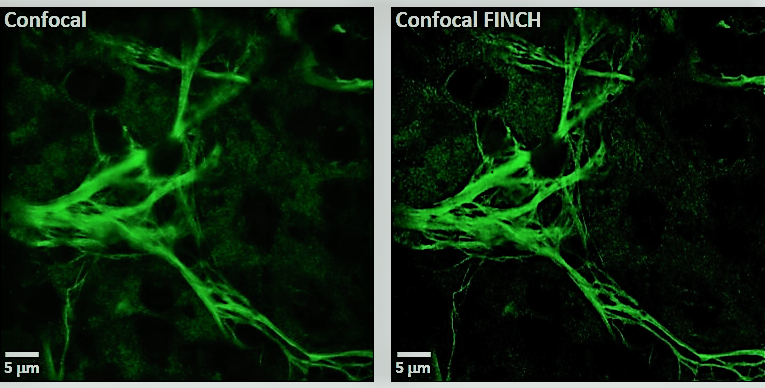
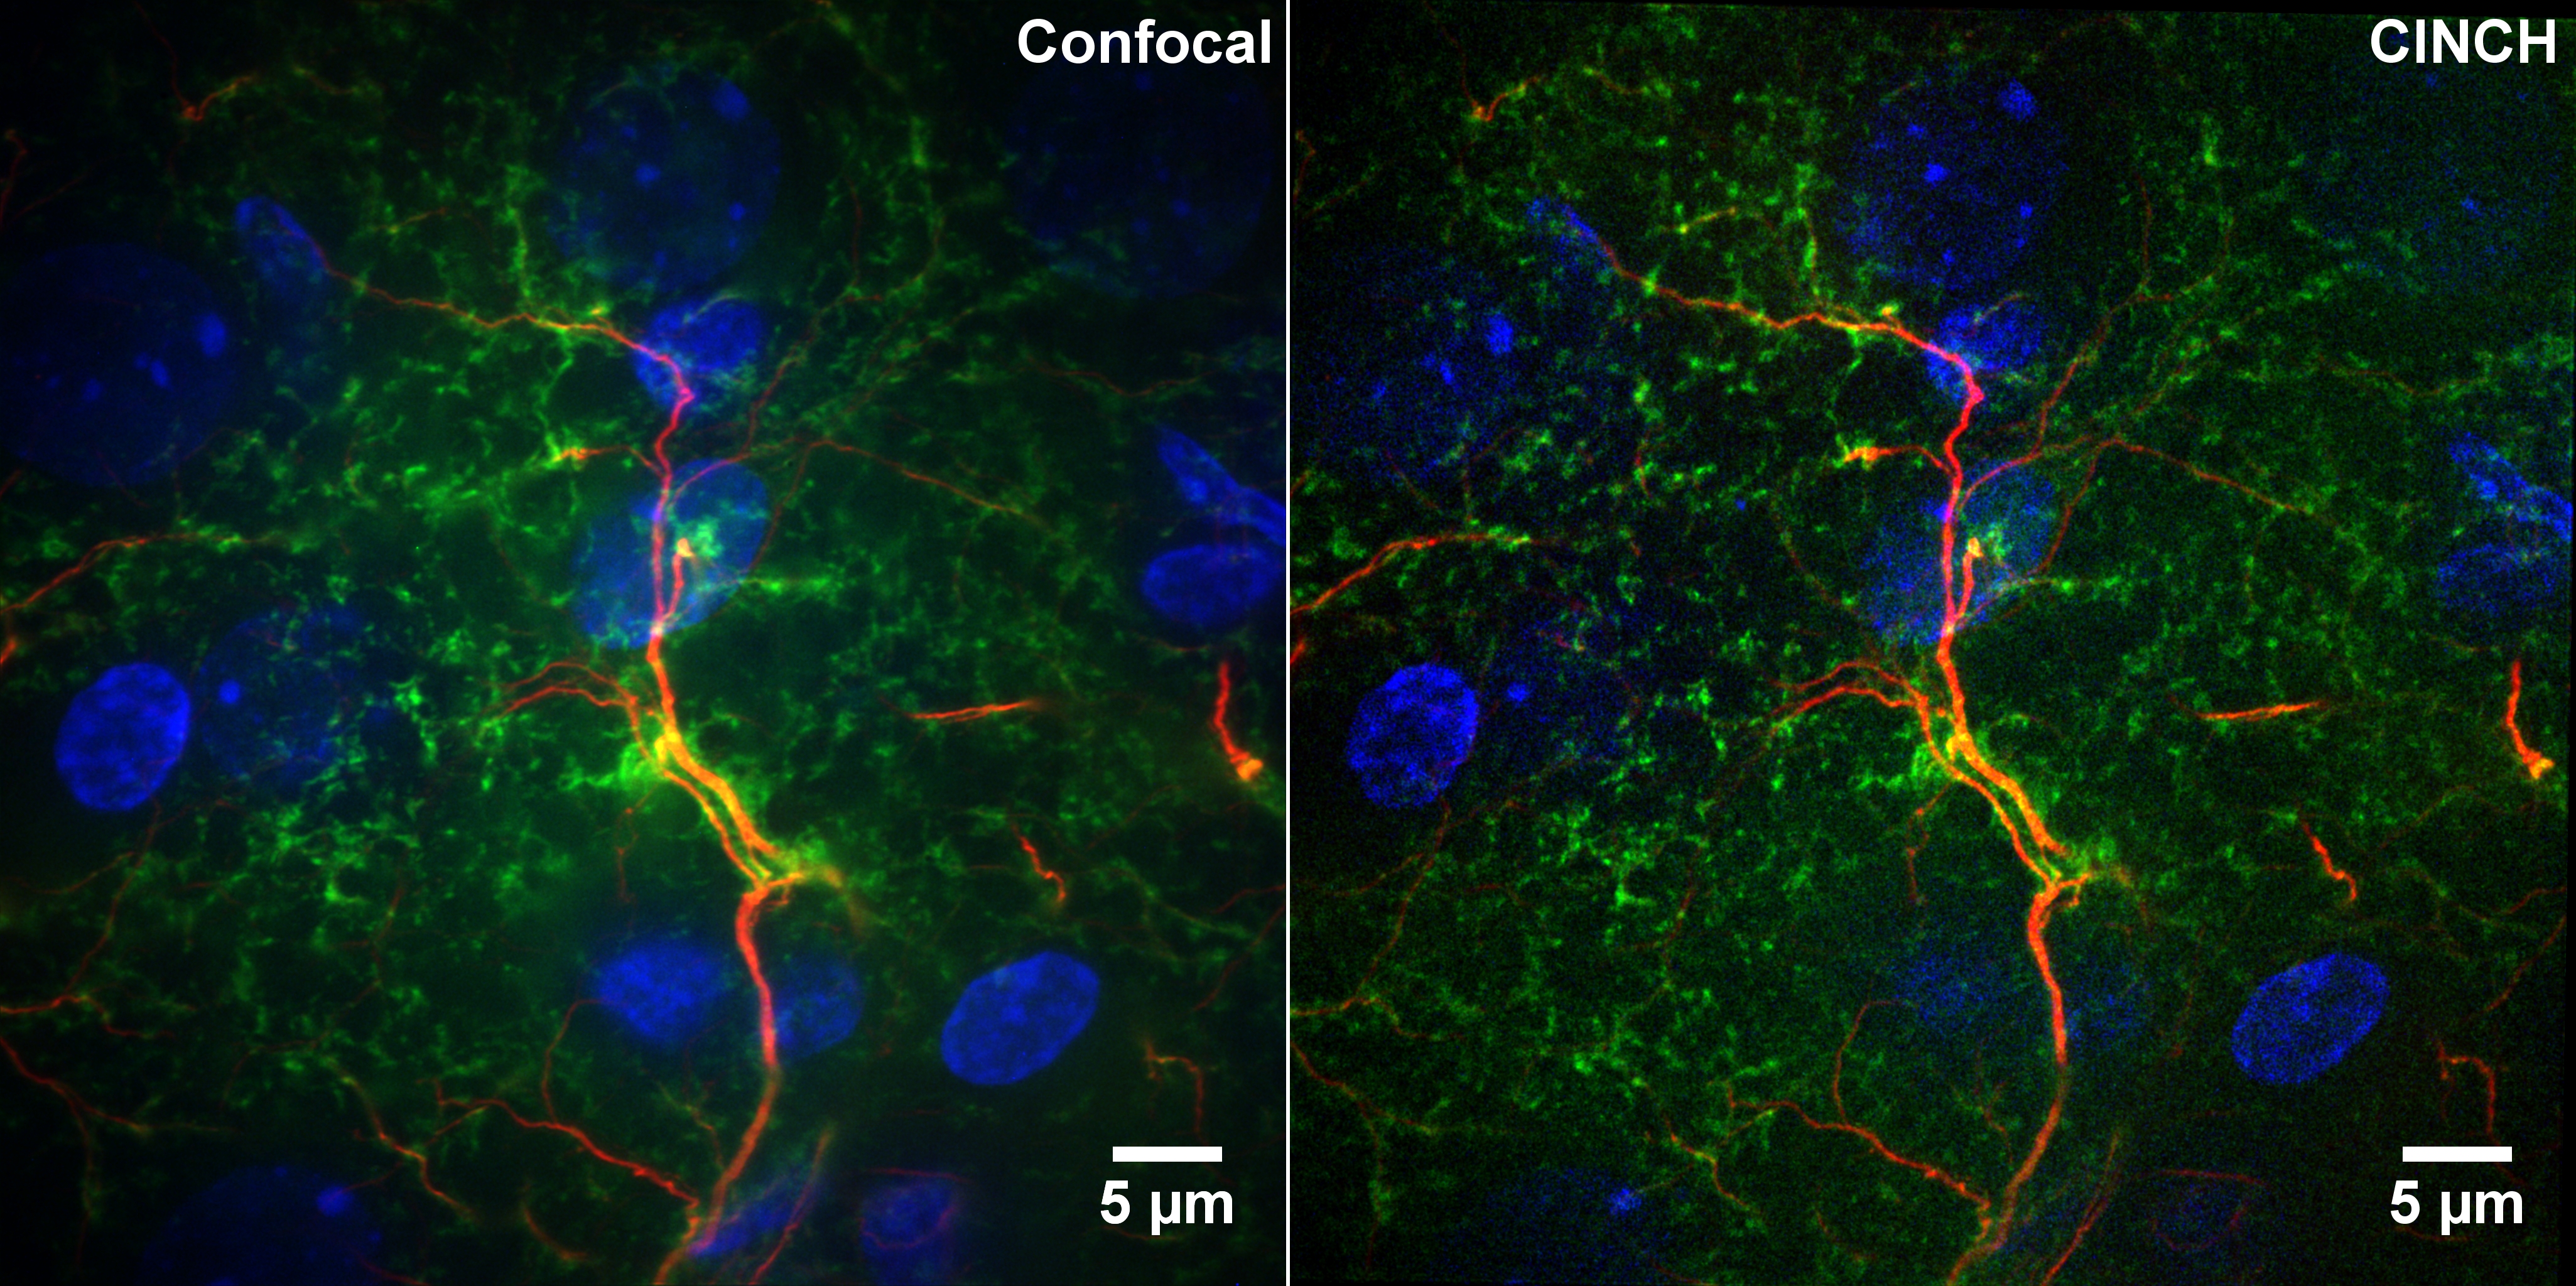
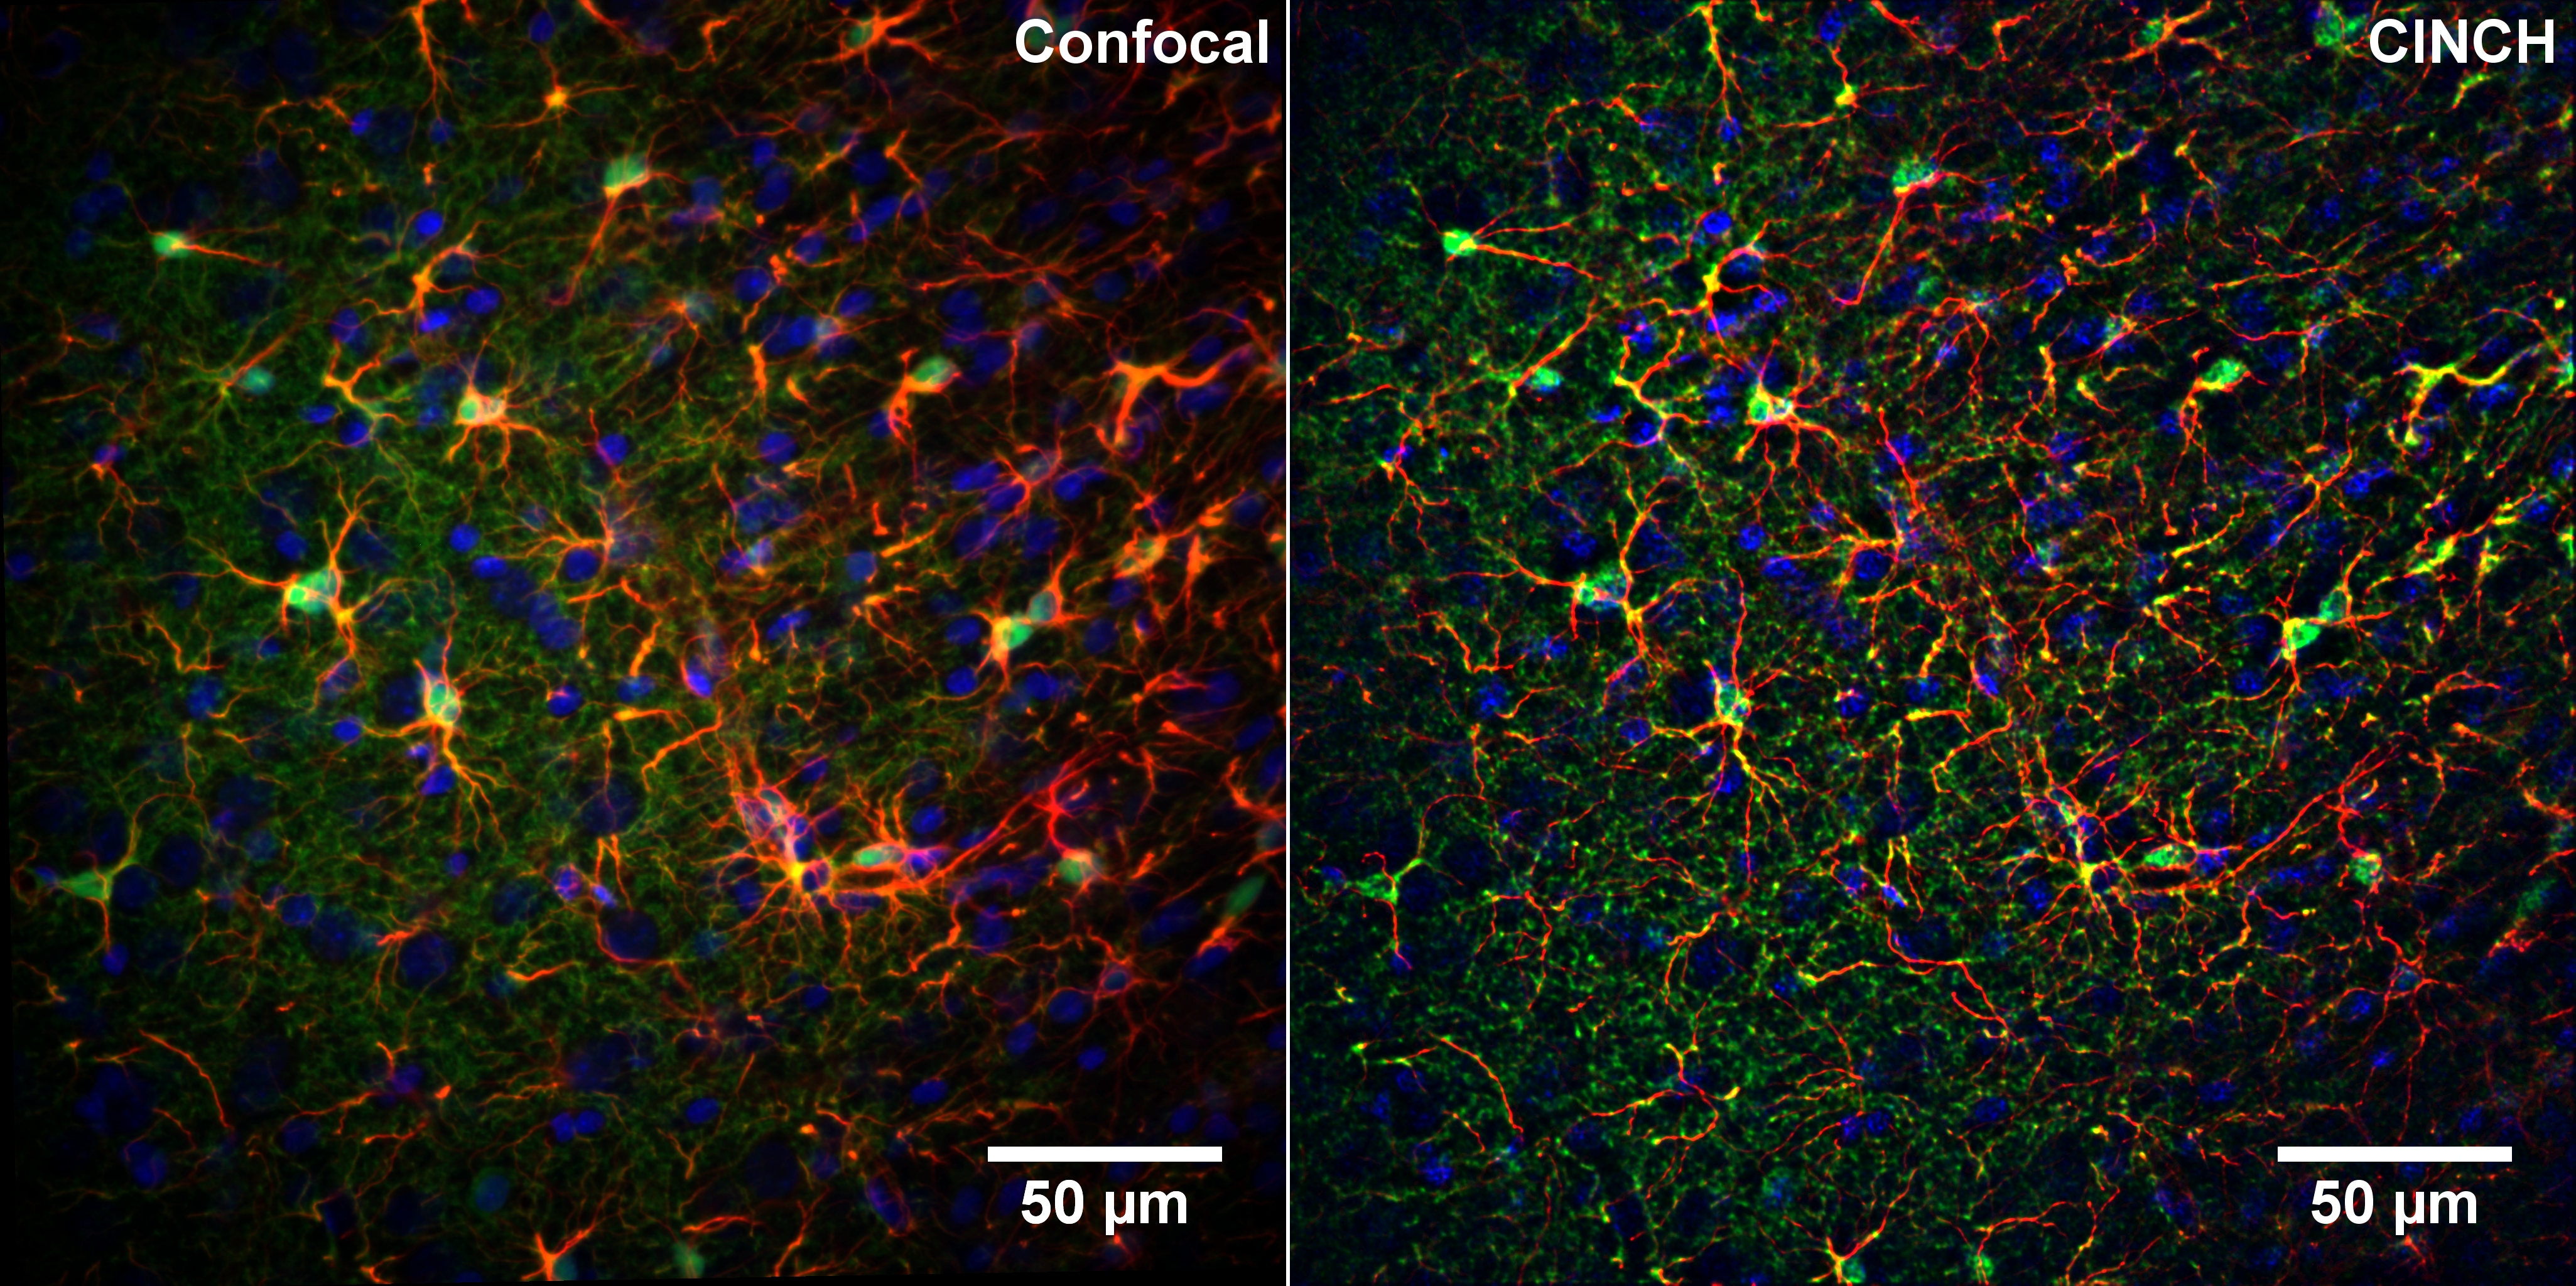
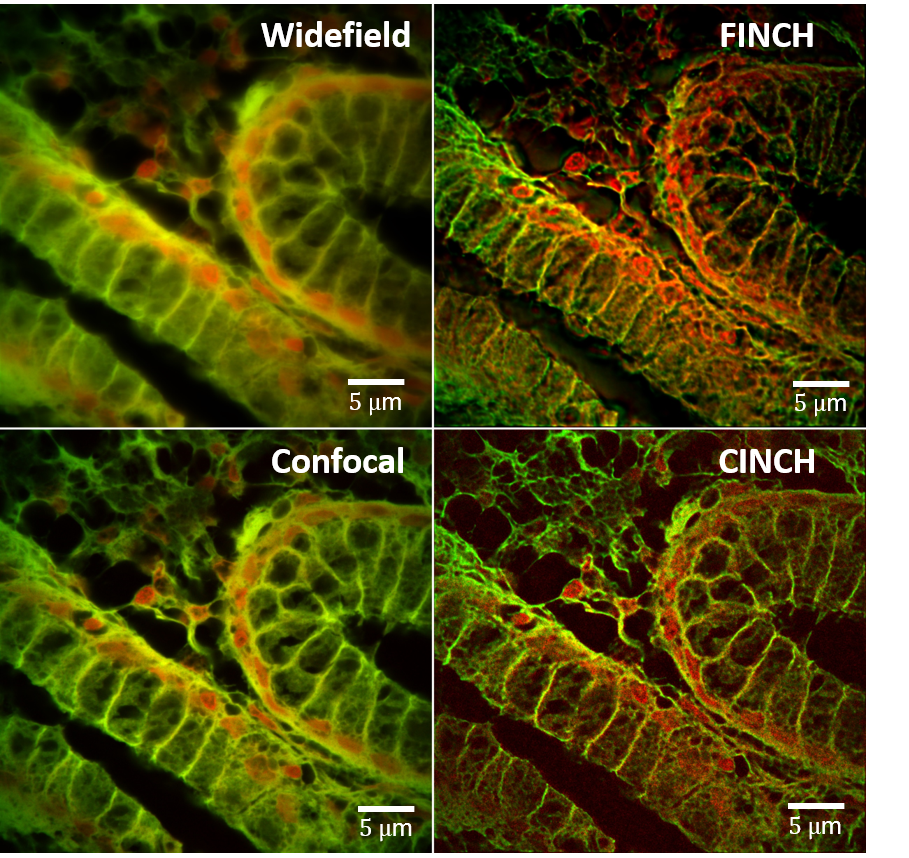
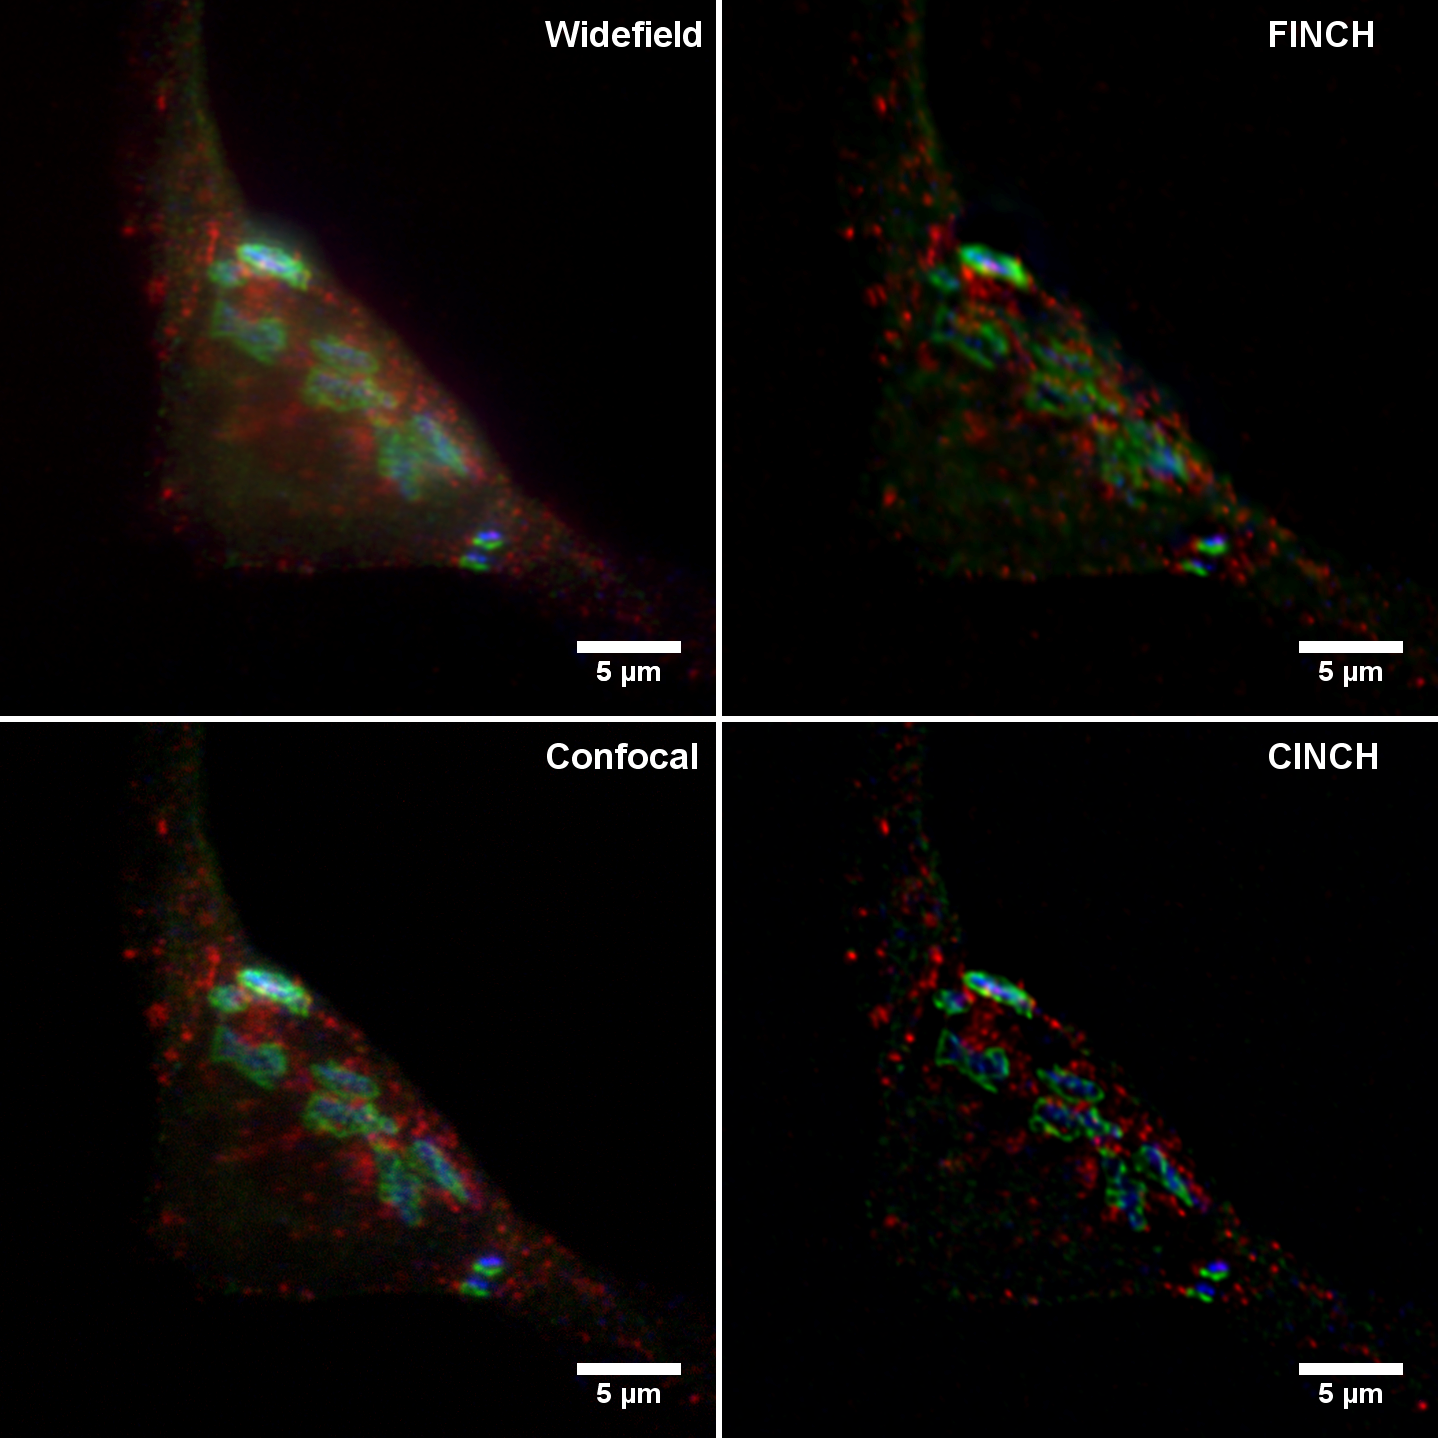
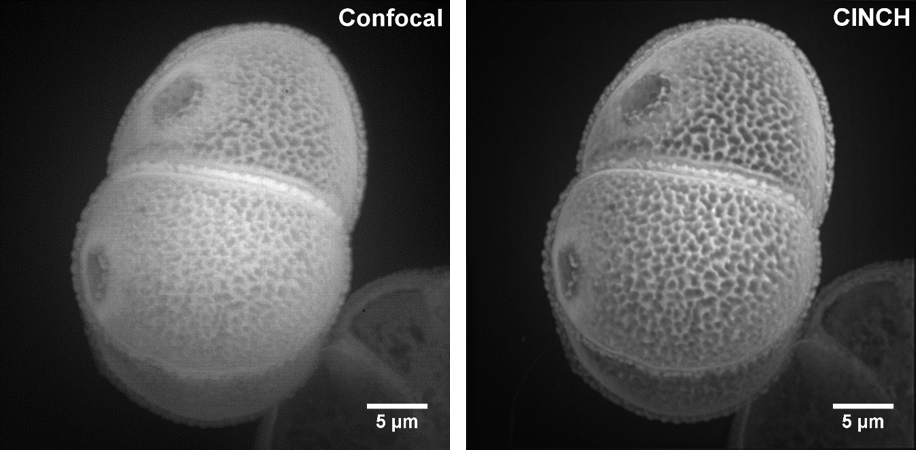
Invitrogen Molecular Probes FluoCells slide #2 imaged with Confocal and CINCH super resolution microscope. Bovine pulmonary artery cell Tubulin stained with BODIPY-FL labeled antibody (green), Actin stained with Phalloidin (red), and Nucleus stained with Dapi (blue). The Confocal image (left) is compared to the identical field FINCH confocal (CINCH) image (right). Full field native 2Kx2K images (28.7 nm/pixel) from a CINCHSCOPE using a 100X 1.4 NA objective. A random selection of microtubules measured 122 ±18 nm in cross-section in the CINCH image compared to 199 ±41 nm in cross-section in the Confocal image. To obtain these measurements, line profiles were drawn through 48 randomly selected microtubules in an orientation perpendicular to the long dimension of the microtubule. The line profiles were then fit to Gaussian functions, with the FWHM of the Gaussian fits accepted as the width of the microtubule.Invitrogen Molecular Probes FluoCells slide #2 imaged with Confocal and CINCH super resolution microscope. Bovine pulmonary artery cell Tubulin stained with BODIPY-FL labeled antibody (green) and actin stained with Phalloidin (red). The Confocal image (left) is compared to the identical field FINCH confocal (CINCH) image (right). Full field native 2Kx2K images (28.7 nm/pixel) from a CINCHSCOPE using a 100X 1.4 NA objective.Comparison of single plane confocal and FINCH confocal images (CINCH) of the same plane of mouse retinal astrocytes labeled with Cy3. Slide courtesy of Dr. Gerard Lutty and Dr. Adam Wenick, Johns Hopkins University Wilmer Eye Institute. Images generated using CellOptic’s CINCHSCOPE with 100X 1.4 NA objective.Mouse brain astrocytes. Blue: DAPI, Green S100B, Red GFAP. Maximum intensity projection of 13 planes, 0.25 micron/slice. Both Confocal and CINCH images have been deconvolved. Slide courtesy of Lynne Holtzclaw, NICHD Microscopy & Imaging Core Facility at NIH. Images generated using CellOptic’s CINCHSCOPE with 100X 1.4 NA objective.Mouse brain astrocytes. Blue: DAPI, Green S100B, Red GFAP. Slide courtesy of Lynne Holtzclaw, NICHD Microscopy & Imaging Core Facility at NIH. Comparison of single plane confocal and CINCH (confocal FINCH) images using CellOptic’s CINCHSCOPE with 20X 0.75 NA objective.Fundic stomach H&E Fluorescence Cy3 and Cy5 channels. Images generated using CellOptic’s CINCHSCOPE with 100X 1.4 NA objective.HeLa cell stained with Golgi and lysosomal protein markers. Blue: TGN46, Green: Giantin, Red: Lamp2. Slide courtesy of Dr. Vladimir Lupashin and Tetyana Kudlyk, University of Arkansas for Medical Science. Images generated using CellOptic’s CINCHSCOPE with 100X 1.4 NA objective.Fluorescent mixed pollen grains imaged in the Cy3 channel. Images generated using CellOptic’s CINCHSCOPE with 100X 1.4 NA objective.